A Day of Deaths 25 Percent Higher Than Spring’s Worst
For the second week in a row, more COVID-19 deaths were reported in the U.S. than at any other time in the pandemic.

Updated at 8:50 p.m. ET on December 17, 2020.
This week, American health-care workers started receiving their first doses of a new COVID-19 vaccine. Early data have shown that the Pfizer/BioNTech vaccine is safe and highly effective, reaching 95 percent efficacy about a week after the second of two doses. The second COVID-19 vaccine under evaluation for use in the United States is expected to receive an FDA emergency use authorization as soon as tomorrow.
COVID-19 vaccine doses won’t arrive in many U.S. nursing homes until next week or the week after that, but a few residents in West Virginia and Florida got their first shot this week. While staff and residents in nursing homes and other long-term-care facilities wait for doses to arrive, 863 more U.S. facilities reported outbreaks than in the previous week, and known cases of COVID-19 in long-term-care facilities are high and rising. Vaccinations in these facilities have the potential to save tens of thousands of lives over the next few months: In the past seven days, states reported more than 5,000 deaths linked to long-term-care facilities.
In the United States as a whole, cases rose only slightly this week (Thursday, December 10, through Wednesday, December 16) compared with the previous week’s numbers, which included Thanksgiving reporting backlogs. Hospitalizations continue to climb, and deaths are rising across the country, reflecting the high cases and hospitalizations we’ve seen since early November. For the second week in a row, more COVID-19 deaths were reported in the United States than at any other time in the pandemic. Yesterday alone, states and territories reported 3,448 COVID-19 deaths, 25 percent more than were reported on the worst day of the spring surge.*
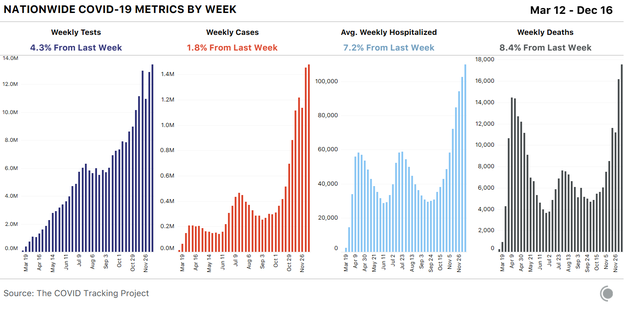
Our count of U.S. COVID-19 deaths currently stands at 298,823, and will almost certainly reach 300,000 this week. It’s worth noting that from March through early November, when official COVID-19 deaths remained well under 250,000, at least 350,000 more people died than usual in the United States. A quarter of those “excess deaths” were officially attributed to causes other than COVID-19, but may actually have been due to the virus. The New York Times offers a close look at where deaths are above normal in the United States.
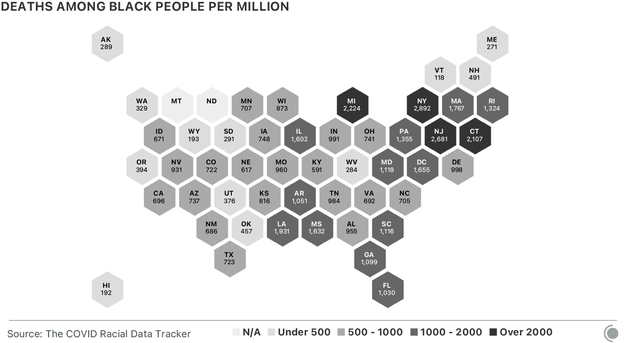
These COVID-19 deaths haven’t affected all Americans equally. As of this week, U.S. states report that more than 50,000 Black people have died of COVID-19. As stark as this number is, it’s also an undercount, in part because for more than 20,000 U.S. COVID-19 deaths reported to date, no racial or ethnic demographic data were reported. Since the beginning of the pandemic, the data have shown that Black people have been much more likely to die than white people in the same jurisdiction. In Washington, D.C., where the known disparity is the most extreme, Black residents have been more than six times as likely to die from COVID-19 as white residents. Nationwide, if these disparities did not exist—if Black people were only as likely to die of COVID-19 as white people are—more than 22,000 Black Americans would still be alive.
At the national level, the good news this week is that cases haven’t risen that much above last week’s big increases—but at the regional level, the story is more complex. Before Thanksgiving, we predicted that case, test, and death reporting would be compromised by the holiday, first dropping during and immediately after the holiday weekend, and then rising sharply as backlogs resolved. We think tests and cases have now largely recovered from this period of erratic reporting.
Death reporting is a complex—and much lengthier—process that often results in backlogs that are opaque to members of the public, and it’s less clear that the death-reporting backlogs related to the holiday have been completely resolved. With Christmas a little over a week away and New Year’s Day a week after that, we are now heading into a doubly disruptive period in COVID-19 data. The actual patterns present in cases and deaths will eventually become clear when complete reporting by symptom onset and date of death becomes available from federal data sources, but through mid-January at least, we should view the daily and weekly movements in the data with extra caution. We also strongly recommend not relying on test-positivity calculations during this period, when reported cases and reported tests are likely to be even less synchronized than they usually are.
Hospitalizations remain the sturdiest metric through periods of reporting disruption. States reported that a little over 113,000 people were in the hospital with COVID-19 yesterday. For comparison, hospitalizations in the spring and summer surges peaked at just under 60,000 people. Regionally, hospitalizations are continuing to decline in the Midwest, but they’re rising everywhere else in the country. If current hospitalization trends continue, the Northeast’s rising numbers will soon cross the Midwest’s declining ones.
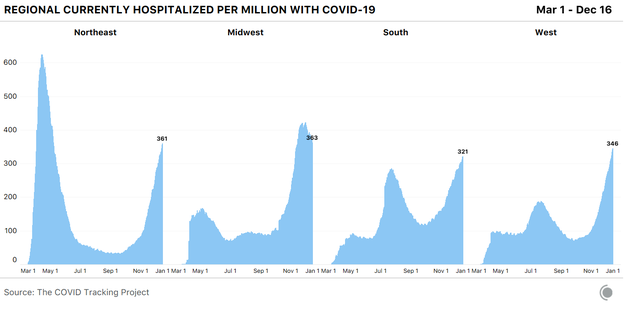
This regional pattern is mirrored in new reported cases per capita. In the Midwest, cases have declined more sharply than hospitalizations, and this is an expected pattern, as hospitalizations trail behind cases. Case rises may be reaching a plateau in the Northeast and are unambiguously rising in the South and West.
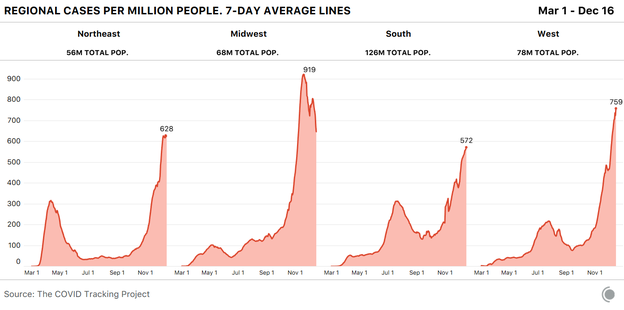
In much of the country, cases appear to be flat or falling compared with last week’s case numbers—which, again, we believe to have been unusually high due to holiday backlogs being resolved. Even on the heels of last week’s very high numbers, 19 states are seeing more cases reported this week than last, and 13 states are reporting case numbers at least 5 percent higher than last week’s.
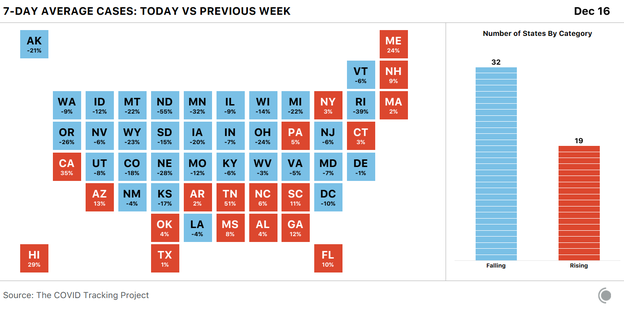
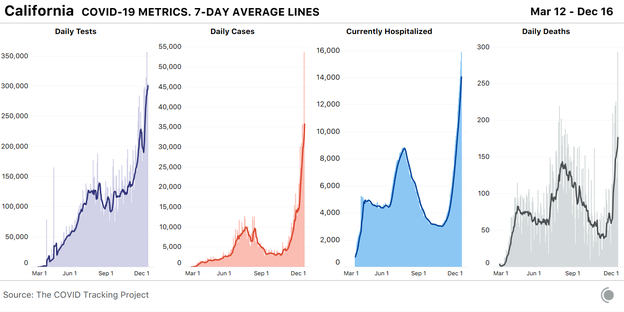
The biggest case increases by percentage this week were in Tennessee, California, and Hawaii, but the scale of outbreaks throughout California far exceeds those of every other state. There are nearly 16,000 people in the hospital with COVID-19 in California, which reported more than 250,000 cases just this week.
California’s regional outbreaks vary dramatically in severity. According to the Los Angeles Times, Southern California has reached 711 new cases per 100,000 people in the past seven days—more than double the Bay Area’s number—and Los Angeles County alone has reported more than 91,000 new cases in the past week. Los Angeles County has a population of more than 10 million people, slightly more than the entire state of Michigan, and according to health officials, one in 80 people in the county has COVID-19 this week. The county’s director of health services said this week that its hospitals are “under siege,” and on average, two county residents are dying of COVID-19 every hour.
The virus is now spreading most quickly in suburban counties in Southern California, where the L.A. Times reports that since the week of Thanksgiving, COVID-19 hospitalizations have doubled in Los Angeles, San Diego, Orange, Riverside, San Bernardino, and Ventura Counties. Orange County is building field hospitals to accommodate the spike in COVID-19 patients, and the number of cases in the county’s jails have jumped from 74 to more than 400 in a single week. California Governor Gavin Newsom said on Tuesday that the state has ordered an additional 5,000 body bags and has 60 refrigerated storage units on standby to accommodate an expected rise in deaths following on the state’s soaring case counts and hospitalizations.
Arizona, a state hit early and hard in the summer’s Sun Belt case surge, now has the second-highest number of people hospitalized per capita. One hospital system in Arizona reports that it expects to reach 125 percent capacity tomorrow. Along with Arizona, 11 other states have now reached 300 COVID-19 hospitalizations per million people in at least two different stages of the pandemic. Louisiana has now reached this alarming level of hospitalizations in each of the country’s three surges to date.
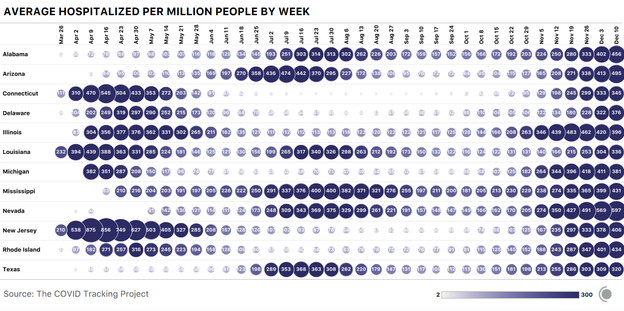
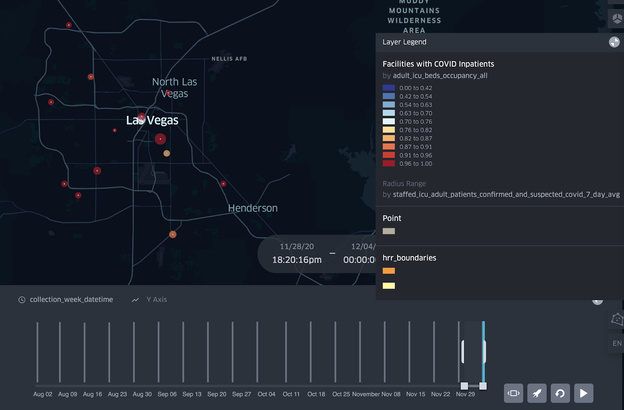
At the very top of the list, however, is Nevada, which has nearly 600 COVID-19 hospitalizations per million people. If we look closely at Las Vegas hospitals in the hospitalization data set published by the U.S. Department of Health and Human Services, we can see that many of them have very high ICU occupancy rates, which implies a high level of strain on the health-care system. Nevada’s overall hospital-occupancy rates have been rising alongside California’s, but they began higher and they have stayed higher.
In the Northeast, Connecticut, New Jersey, and Rhode Island are all reporting COVID-19 hospitalization rates of more than 300 per million people, and Rhode Island is now reporting hospitalizations well above its spring peak. In New York, Governor Andrew Cuomo has ordered hospitals to shift to “crisis management mode” ahead of an expected surge in hospitalizations. Massachusetts Governor Charlie Baker said that COVID-19 hospitalizations in the state have increased by 93 percent over the past three weeks alongside a 73 percent rise in the number of patients in intensive-care units, and urged residents to avoid holiday gatherings.
Florida is reporting more than 5,100 people hospitalized with COVID-19 in the state this week, slightly more than half the number of people hospitalized during the state’s summer surge.
Last week, we wrote about a new data set from the Department of Health and Human Services that reports facility-level information on COVID-19 hospitalizations and hospital capacity across the United States. We are continuing to explore these data alongside the numbers we compile from states, and this week, the federal data show that in many states, a large number of facilities have almost no ICU beds available. In Oklahoma, 65 percent of hospitals have 10 percent or fewer open ICU beds. Many of these facilities are small, and as their limited capacity fills, the burden on larger regional hospitals will increase as they are forced to take on patient overflow.
Nicki Camberg, Alice Goldfarb, Erin Kissane, Alexis Madrigal, Jessica Malaty Rivera, Sara Simon, and Peter Walker contributed to this report.
*This article has been updated to reflect death figures for Oregon that became available after publication. The updated total for December 16 is 3,448.